DIY-ing My Way to Better Ventilation
Cordelya writes about the process of developing her own flavor of CO2 monitor using a Raspberry Pi computer and a CO2 sensor.
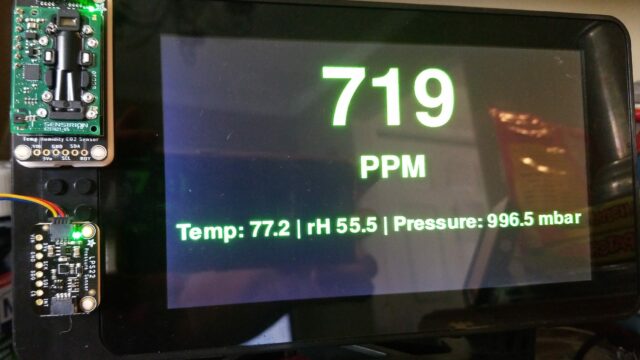
If you scroll back two posts, you’ll find one about COVID-19 risk mitigation strategies. One of the items in that post was DIY CO2 monitoring – based on research that showed that CO2 concentration in an indoor space correlates with infection risk. Since I wrote that post, I’ve actually built two DIY monitors, and they’re being used on a weekly basis to support decisions around when additional ventilation (opening windows, using fans to circulate fresh air) is needed. Note that this measure is in addition to having all participants wear masks 100% of the time and running an inexpensive, ad-hoc air filter in one of the two spaces used.
From Humble Beginnings…
I already had both a MagTag and a PyPortal, two small Internet-enabled devices you can program using a specialized version of Python. I started out making just one purchase: a Qwiic/STEMMA compatible CO2 Sensor breakout board plus a cable to connect it. When the sensor and cable arrived, I discovered that, while I could connect to the MagTag, I didn’t have the correct cable to connect the sensor to the PyPortal, which is really what I wanted – for the color screen. Back to the online cart I went for more spending!
Meanwhile…
While I waited for the correct cable to arrive, I gave the sensor a spin using my MagTag, which is presently employed as a small weather widget. Since it was already reporting useful information, why not add a little more, right?
The Adafruit SCD-30 sensor reports CO2 concentration, relative humidity, and ambient temperature. You can get better accuracy from it by regularly feeding it the current atmospheric pressure in millibars. If you have access to a cylinder of calibration gas, you can use that to calibrate it. Otherwise, it has a “self-calibration” feature where the sensor will adjust itself as long as a) you allow it to run continuously and b) you give it access to fresh air at least once every 24 hours. This works because the average concentration of CO2 in fresh outdoor air is approximately 400ppm. The sensor will keep track of the daily low concentration and make adjustments based on those readings after several days of continuous operation.
The first thing I did was add the reported CO2 concentration and ambient temperature to the weather widget display. It was a tight squeeze, but I was able to fit both in at the end of the location name. Ok! I got the hang of using the SCD-30 Python library to fetch information. That’s a great start.
And then, Delivery Day!
Once my correct cable arrived, I moved the sensor over to the PyPortal and began working through other tasks. I hadn’t yet learned how to use CircuitPython to position and display text, so I did that next. By the time I checked my script into a shiny new git repository, it would wait for the sensor to report that a reading was ready, then pull the CO2, humidity, and temperature readings into variables. It would convert the temperature to display in degrees Fahrenheit, and display all three metrics on the screen, in green if below 1000ppm CO2, in yellow if between 1000 and 1500, and in red if above 1500ppm. I added in changing the color of the PyPortal’s neopixel LED a little later on.
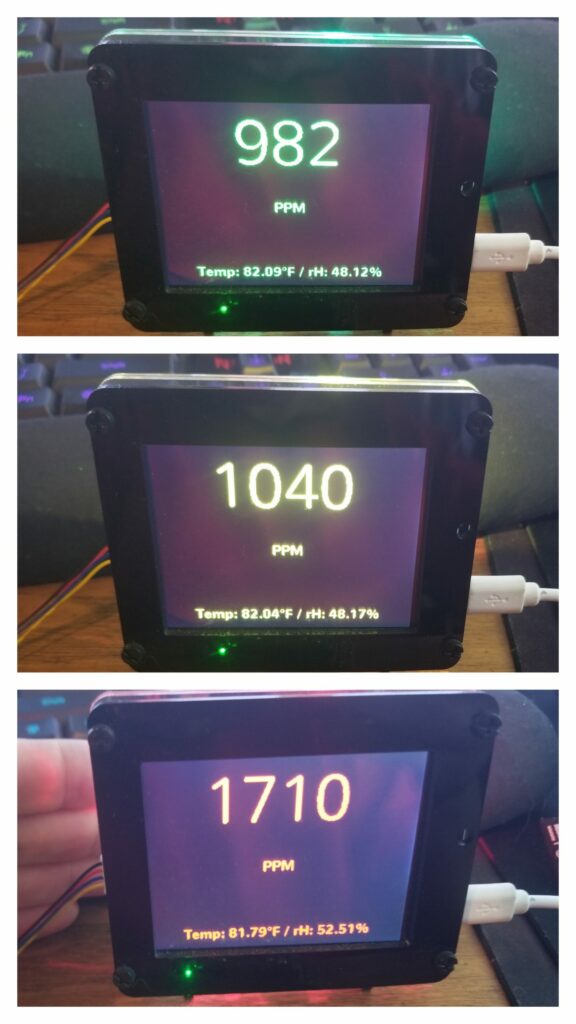
Just having a CO2 reading wasn’t enough for me, though! I ordered a pressure sensor and a RTC board, both also Qwiic/STEMMA compatible, and some more cables. I wanted a system that was accurate, that could work without Internet access, and that could support writing sensor readings into a log file with a timestamp for analysis later.
Trouble
As I was nearing completion of my PyPortal script, I discovered an issue: it would boot up just fine if I connected it to my computer (via USB; that’s how the executable scripts are accessed), but would boot up very slowly or not at all if I powered it by an electrical socket adapter (“wall wart”). I did a bunch of testing and consulted with the PyPortal experts on the forums, and finally, the source of the trouble was identified: the PyPortal, by default, supplies 5v to the JST I2C connector. If one is going to run the kind of sensors I was running, the power level needs to be shifted to 3v3 (by cutting a PCB trace and soldering two adjacent pads together). That isn’t something I wanted to do to my PyPortal, so I decided to pivot to another piece of hardware I already had.
Do you like Pi?
Until recently, there were six Raspberry Pi boards in my house, ranging from Model B Rev 2 boards (2012 says hi!) all the way to an 8GB Raspberry Pi 4. Each one is host to one or more locally-running self-hosted services, including RetroPie, Plex, PiHole, WordPress, Grocy, Django, Prometheus, and Grafana.
I ordered a SparkFun Qwiic HAT- an adapter that seats onto a Raspberry Pi’s GPIO pins and has four Qwiic connectors. I decided to use my Portable Pi, a Raspberry Pi 3 + 7-inch official touchscreen housed in a SmartiPi enclosure with separate power input for the screen. When I bought it, I also purchased a Pelican case with customizable foam so it could travel safely. It would be just the thing to bring along with me to the local weekly SCA fighter practice and art night.

Don’t Speak Too Loudly, or Everyone Will be Wanting One
Yep. I talked to people about it. I talked to local SCA people about it. I talked about it way back when I was still working out the script with the PyPortal. “How much would it cost to build one?” they asked. (The answer is, somewhere between $130 and $160, for a build with a color screen, depending on what sizes and types of parts are chosen.)
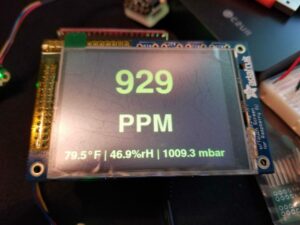
The local chapter can vote to spend money on such things, and they did. So I ordered some parts. I went with the following configuration:
- Raspberry Pi Zero W (with Header)
- 2.8″ mini TFT touchscreen
- SparkFun Qwiic HAT
- GPIO splitter (seats on the Raspberry Pi’s GPIO and splits off two sets of connected GPIO pins – one for the touchscreen and one for the Qwiic HAT)
- Adafruit SCD-30 CO2 sensor breakout with Qwiic/STEMMA ports
- SparkFun Qwiic LED Stick
I supplied a micro-USB cable for power because I have loads of them around the house. After I complete the configuration, I’ll 3D print an enclosure to hold and protect it all.
Of course, a different screen means a different Python library for the display! So I needed to rework the script again. While I was doing that, I was also asked if it can do audible alarms (it totally can with minimal fuss if you have a Bluetooth speaker handy!) so I added that capability. I wanted to be able to easily import logged data into a MySQL database for data display in Grafana, so I set up a second log type. I added command line flags somewhere in there – you can turn debug on (or off, depending on what the default is), enable Grafana logs (off by default, you need to supply a location name for the log), pass in a local air pressure reading if you don’t have a pressure sensor attached, specify a log filename, and turn regular logging on/off (depending on the default).
Add a Little Spark

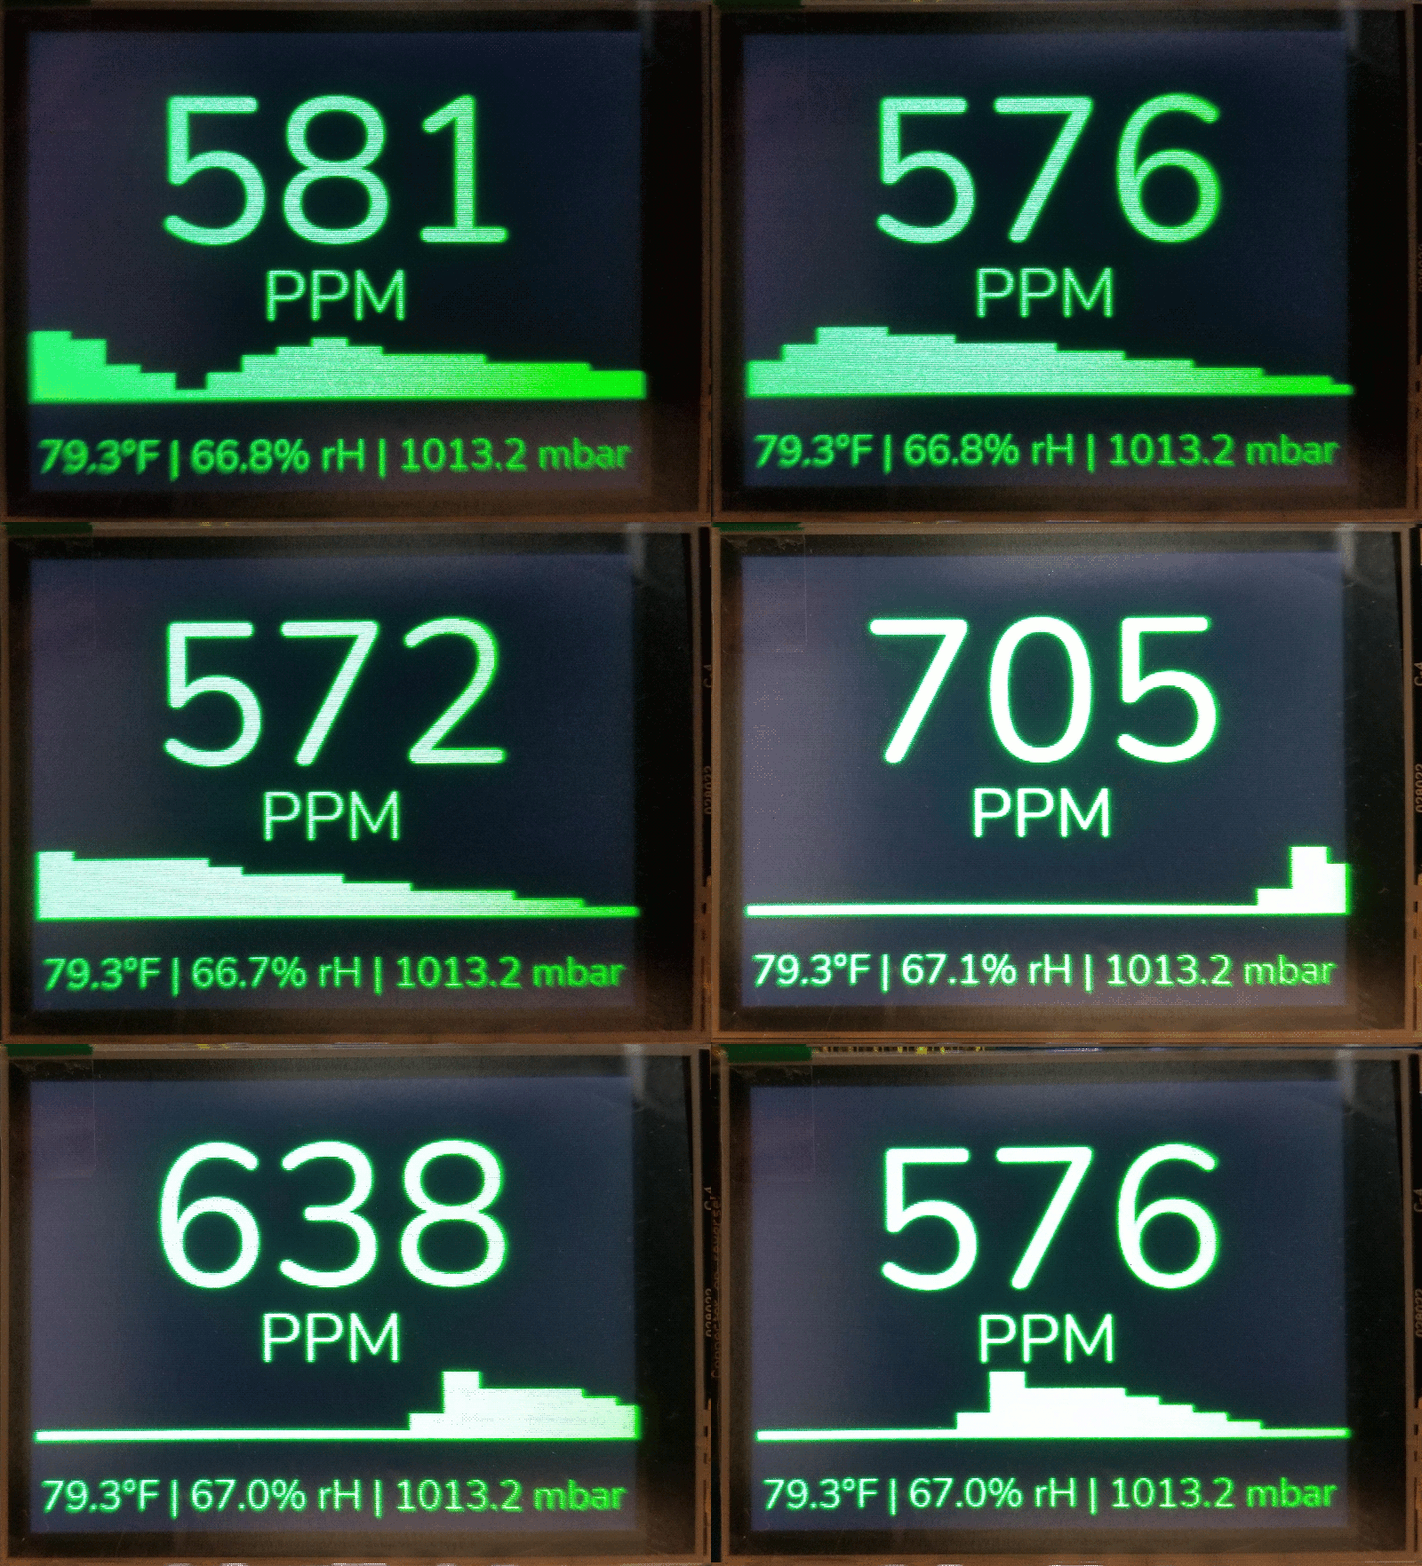
Most recently, I added a sparkline history – the last 18-25 CO2 readings are displayed across the screen between the “PPM” label and the temperature / rH / pressure label. This is not a true graph, as the column heights are freshly calculated every time a new reading is added and the oldest reading is discarded. A “zero” column height is assigned to the lowest number in the set and a “100” column height is assigned to the highest number in the set. The remaining numbers are assigned varying column heights based on their relative position between the high and low numbers, and columns are Unicode characters in the Block Elements group.
The sparkline will show you the trend over the last minute or so.
Eventually, I will build a custom enclosure for it to protect the delicate parts against damage.
Cool, How Can I Get One?
The short answer is: you build it yourself. If you choose the exact same configuration as one of the builds I’ve done so far, you’re in luck – I’ve posted the entire CO2 monitor git repository on my GitLab with an Open Source license. If you choose something different, you may be partly or completely on your own.
If you’re located in Harford or Eastern Baltimore Counties in Maryland, or York or Lancaster Counties in Pennsylvania, I’m available for hire to do custom builds at $75/hr plus the cost of parts and parts shipping. If you just want advice, you can get that for $35/hr.
The graphical output of this script can be piped out to an external display via HDMI. It can be modified to work with only a controller and an array of multi-color LEDs, a tiny OLED screen, or e-paper screens. Add a LiPo battery and a battery management board and you’ve got something very portable you can carry around with you for air quality sampling! Remember when choosing hardware that your chosen configuration is not guaranteed to work with my scripts out of the box until they’ve been tested, and even then, things can and do go wrong (usually it’s fixable and often not terribly expensive).
This is a great project for kids – younger ages will need assistance, but teens will likely be able to do this unassisted. I’m available for tutoring in the same locations as above, but a parent or guardian must be present at the location at all times.
One Last Thing
Remember that Raspberry Pi count I mentioned earlier? Today there are 8 of them in my house. The two new ones are Zero W models, one with headers, one without. One was purchased for this project, the other for an unrelated project).
Editor’s note: as of late 2022/early 2023, my household no longer purchases Raspberry Pi products. We’ve switched to using Libre Computers’ single-board offerings and have also branched out to the Feather line of microboards for things that don’t need a full blown server.
 Cordelya Sharpe